Searching for a gold price forecast right now, requires more than you looking at a chart. You want to know whether the correction that pulled gold back to roughly $4,000 per ounce in July 2026 is the end of the story, or simply a pause before the next leg higher. You may also be deciding what it means for your own savings, whether you already own precious metals or are considering a first purchase.
Gold set a record above $5,500 per ounce in late January 2026, then gave back about a quarter of its value as interest rate expectations shifted. Most major banks now see gold finishing 2026 somewhere between $4,500 and $5,200 per ounce. The $10,000 figure is real, but it comes from a small group of named analysts describing a multi-year scenario, generally 2029 or 2030, not a prediction for this year.
This guide walks through where the price stands today, what the latest institutional forecasts actually say, who is making the $10,000 case and why, and how a long-term investor might think about all of it.
Everything below is education, not financial advice, and every forecast you will read is an opinion that its author can and often does revise.
Where the Gold Price Stands in July 2026
Gold is trading near $4,000 per ounce, close to its lowest level in nine months. That number can feel alarming if you anchored to January, when gold capped a string of a dozen record highs by touching levels above $5,500 intraday, according to the World Gold Council. It feels very different if you zoom out: gold traded below $1,600 per ounce as recently as 2020.
Three forces explain most of the recent weakness.
- Interest rate expectations have flipped: Strong labor data and stubborn inflation have markets pricing in the possibility of further Federal Reserve rate hikes, and Cleveland Fed President Beth Hammack has publicly suggested more tightening may be needed. Higher yields tend to pressure gold because gold pays no interest.
- The dollar has strengthened: A firm dollar makes gold more expensive for buyers overseas, which historically has cooled demand.
- Geopolitics cuts both ways: The conflict between the United States and Iran, including attacks on tankers near the Strait of Hormuz, has pushed oil prices and inflation worries higher. Safe haven buying has cushioned gold during the worst headlines, while hopes for negotiations have taken some of that premium back out.
On the technical side, analysts at FXEmpire note that spot gold needs to break and hold above $4,200 to confirm a bullish reversal, with the market finding support between roughly $3,640 and $3,965. In plain terms, gold is consolidating in a range while the market decides what comes next. You can watch the current spot price on Orion’s live gold price chart at any time.
What the Latest Gold Price Forecasts Say
Institutional forecasts moved up fast during the January rally, and many have been trimmed since. That churn is normal, and it is exactly why a forecast should inform your thinking rather than dictate it. Here is where the major calls stood as of July 2026.
| Institution | Forecast | Timeframe |
|---|---|---|
| Goldman Sachs | $4,900 per ounce | End of 2026 |
| JPMorgan | $4,500 per ounce | Fourth quarter of 2026 |
| Bank of America | $4,800 per ounce | Fourth quarter of 2026 |
| Morgan Stanley | $5,200 per ounce | Second half of 2026 |
| ING | $4,300 average Q3, $4,600 average Q4 | 2026 |
| DZ Bank | $5,000 per ounce | Within 12 months |
Two moves stand out. Goldman Sachs raised its December 2026 target to $5,400 during the January highs, then reset it to $4,900 in June while arguing that gold “is not done” and that central bank diversification remains a powerful driver. JPMorgan made the sharpest cut, lowering its fourth quarter target by roughly 25% to $4,500, citing weaker demand from key buyers, as reported by Reuters.
Notice what these numbers have in common: every one of them sits above the current spot price. Even after the corrections and the trimmed targets, the large research desks still describe a market with room to recover. They simply disagree about how fast.
Who Is Actually Calling for $10,000 Gold?
The $10,000 conversation is not new. Orion covered the early wave of these calls in our article on why experts began talking about $10,000 gold, back when the metal was still climbing toward $4,200. Since then, the projections have become more specific about names, numbers, and timelines.
Ed Yardeni of Yardeni Research has projected that gold could reach $10,000 per ounce by 2029, pointing to geopolitical risk and mounting fiscal concerns in the United States as the primary catalysts.
Doug Moglia, macro and market strategist at Rockefeller Global Investment Management, made a similar case in May 2026, telling Kitco News that gold could trade above $5,500 in 2027 and reach $8,000 before 2030, with overshoot potential to $10,000 per ounce.
Trajectory watchers have run the simple math. Fortune calculated last fall that if gold kept the pace it had held since late 2023, the price would touch $10,000 sometime between mid-2028 and early 2029. This year’s correction has slowed that clock, but the exercise shows how quickly compounding works at the growth rates gold has posted in this cycle.
What would have to go right
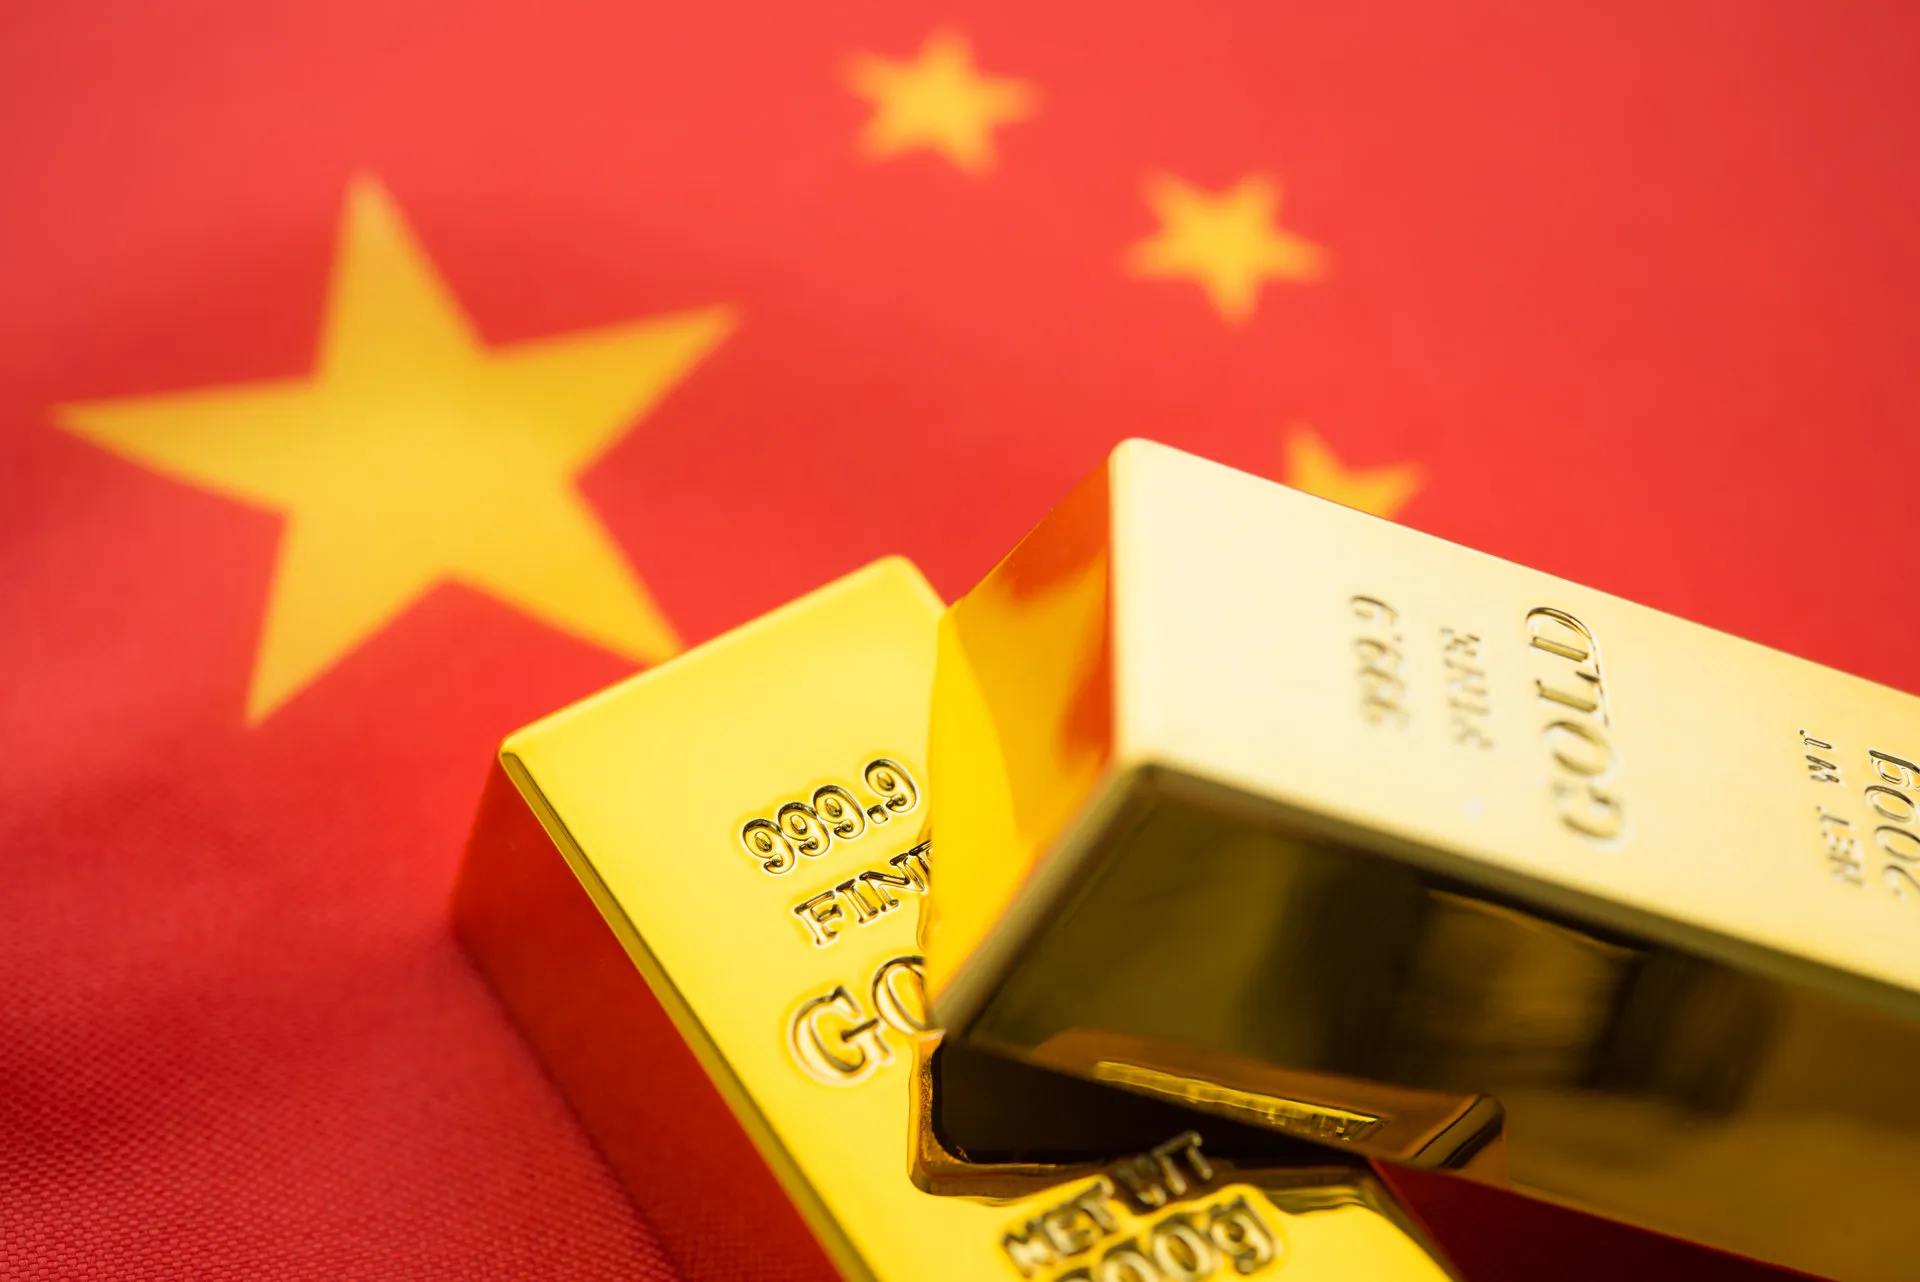
For gold to reach five digits, several of today’s tailwinds would need to persist for years. Central banks, led by emerging markets and the steady stream of headlines about China buying gold for its reserves, would need to keep purchasing at or near record levels as they diversify away from the dollar. Inflation would need to stay sticky enough to keep real interest rates unattractive. Government deficits would need to keep investors questioning paper assets. History suggests these conditions have often supported gold prices, though none of them, including central bank buying, guarantees a higher price.
What could keep it from happening
The bear case is equally concrete. If the Federal Reserve hikes further and inflation finally cools, higher real yields would give income-seeking investors little reason to hold a metal that pays none. A persistently strong dollar would suppress overseas demand. JPMorgan’s July cut was driven by exactly this kind of demand softness. Gold prices fluctuate, they can be volatile in both directions, and a forecast of $10,000 is a scenario, not a schedule.
Short Term and Long Term Tell Two Different Stories
The most useful way to read any gold price forecast is to separate the next few months from the next several years, because right now they point in different directions.
The rest of 2026: a fight over $4,200
Near-term projections are cautious. LiteFinance’s July analysis puts gold in a range of roughly $3,365 to $4,236 for the month, and Trading Economics models project gold around $4,090 by the end of the quarter. Until the price clears $4,200 convincingly, traders will keep treating rallies with suspicion. Expect headlines about the Fed, the dollar, and the Middle East to drive sharp swings in both directions.
2027 to 2030: the structural bull case
Stretch the horizon and the picture changes. Most published gold price predictions for 2030 land well above today’s spot price, and the drivers behind them are structural rather than headline-driven: a multi-year shift by central banks toward gold as a reserve asset, persistent government deficits in the developed world, and a long-running effort by countries like China to reduce dependence on the dollar. These forces move slowly, which is why analysts who focus on them tend to publish the highest long-range targets. They are also the same forces that the World Gold Council credits with putting a floor under prices during this year’s correction.
Should You Buy Gold Now, or Wait for Lower Prices?
This is the question behind most forecast searches, and it deserves a straight answer: nobody can time this market reliably, including the banks whose targets you just read. Anyone who claims to know where gold will trade next quarter is guessing, whether their guess is $3,500 or $10,000.
What long-term investors can control is process. Many use dollar-cost averaging, buying a fixed amount at regular intervals, so that corrections like this one lower their average cost instead of testing their nerve. Many financial commentators cite allocations of roughly 5 to 15% of a portfolio in precious metals, with the right figure depending on your age, retirement timeline, and existing market exposure. Investors with a decade-long horizon also tend to care less whether their entry was $3,900 or $4,100, because their thesis rests on the structural drivers above rather than on next month’s Fed meeting.
It is also worth remembering what corrections have historically meant in this market. The retreat from $5,500 to $4,000 feels severe, yet gold remains far above where it traded three years ago. If your worry is that you are already too late, notice that the analysts calling for $6,000 or $10,000 gold are describing a move measured in years, not weeks. And if you already own precious metals, a correction is not a verdict on your decision: the long-term drivers those analysts cite, from central bank demand to fiscal deficits, are the same ones that supported your original thesis.
For a retirement saver, the practical question is rarely “is this the exact bottom?” It is “does gold have a role in my plan, and if so, how do I add it in a disciplined way?” That is a conversation worth having with your financial and tax advisors before you act.
Gold Price Forecast FAQs
What is the gold price forecast for 2026?
As of July 2026, major banks see gold finishing the year between roughly $4,500 and $5,200 per ounce, with Goldman Sachs at $4,900, JPMorgan at $4,500, Bank of America at $4,800, and Morgan Stanley at $5,200. All of these are projections, not promises, and several have already been revised this year.
Are gold prices expected to fall further?
Some near-term models allow for it. LiteFinance’s July 2026 range extends into the mid $3,000s, and technical analysts see support between roughly $3,640 and $3,965. At the same time, most year-end institutional targets sit above the current price. Short-term weakness and long-term strength can both be true.
Will gold go to $5,000 an ounce?
Several institutions think it could. DZ Bank expects gold to return to $5,000 within 12 months, Morgan Stanley’s second-half target is $5,200, and gold already traded above $5,500 this January. Whether it happens again depends largely on the Fed, the dollar, and central bank demand. No price level is ever guaranteed.
What could gold be worth in five years?
Published projections for 2030 span an unusually wide range, from around $6,200 to above $10,000 per ounce, with Ed Yardeni’s call for $10,000 by 2029 among the most cited. A five-year forecast carries far more uncertainty than a one-year forecast, so treat these numbers as scenarios that depend on inflation, deficits, and reserve buying staying on their current path.
How Orion Metal Exchange Helps You Act on Your Own Outlook
Forecasts frame the decision, but the decision is yours. When you are ready to act on it, Orion Metal Exchange is built for exactly the kind of investor this article was written for: people protecting retirement savings, not chasing trades. We publish our product prices online so you can see what you would pay before anyone calls you, and our approach is no-pressure by design.
You can follow the market in real time on our live precious metals price charts, then browse widely recognized, highly liquid coins like the American Gold Eagle on our gold products page. If your goal is retirement protection, our dedicated SDIRA department can help you roll an existing 401(k) or IRA into a tax-deferred self-directed precious metals IRA, handling the paperwork and the IRS-approved depository storage requirements from start to finish. Consult your tax advisor regarding your individual circumstances.
Not sure where to start? Request Orion’s Free Investor Kit and a dedicated IRA specialist will walk you through your options, with no pressure and no obligation.