We’re barely three months into 2026, and cracks in the U.S. economy are becoming harder to ignore. Wall Street’s long-standing concerns about overvaluation are colliding with global unrest, persistent inflation, and a softening labor market. Meanwhile, consumers are increasingly under pressure from higher costs, rising debt, and growing financial strain.
Key market indicators and sentiment trackers suggest this unease is justified, and in the months ahead, these warning signs should not be taken lightly.
The CAPE Ratio
The CAPE Ratio, which stands for the Cyclically Adjusted Price-to-Earnings ratio, was introduced back in 1988 by economists John Campbell and Robert Shiller. It is a key measure of stock market valuation and has become a respected forecasting tool for future stock returns. The ratio is derived by dividing a company’s current share price by its average earnings per share (EPS) over the past 10 years, adjusted for inflation.
According to Charles Schwab,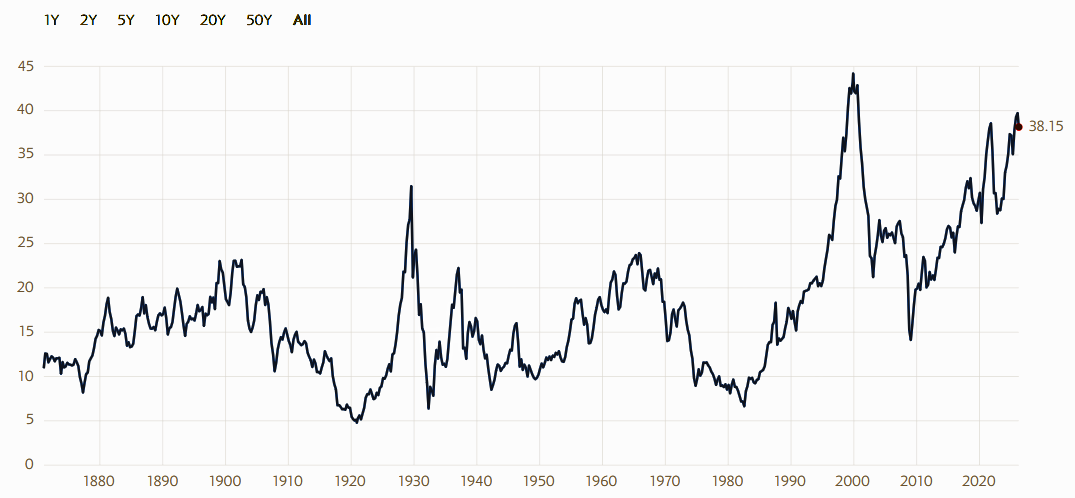
“The Shiller CAPE ratio is typically used to value the S&P 500® index (SPX) and is lauded for its ability to smooth out earnings fluctuations caused by business cycles and recessions, which some argue may provide a more stable, long-term view of market valuations. A ‘high’ Shiller CAPE ratio—anything significantly above its long-run average of roughly 17— indicates the broad market may be overvalued, while a low reading suggests the market may be undervalued.” [1]
The current CAPE ratio is hovering close to 40 suggesting an historic market over-valuation. It is now at its highest point since the dot.com bubble back in 2000 and according to Investopedia, “historically high CAPE ratios can signal potential market corrections, as first observed in 1997 and later validated during the 2008 market crash.” [2]
This overvaluation, of course, points to a potential AI bubble fueled by the surge of enthusiasm, capital inflows, and excitement surrounding artificial intelligence companies — many of which have yet to generate profits.
Time Magazine calls the AI bubble a basic math problem. “There is a fundamental mismatch between the trillions being invested in the infrastructure to develop AI and the billions that people and companies are spending to use AI.” [3]
To put the size and scope of AI mania in perspective, the Wall Street Journal says that the financing of AI data centers is “bigger than the railroad expansion of the 1850s, the Apollo space program that put astronauts on the moon in the 1960s, and the decadeslong build-out of the U.S. interstate highway system that ended in the 1970s.” [4]
The problem with all bubbles, of course, is that they eventually bust, and the AI bubble of 2026 could unwind quickly and result in a painful correction.
The Fear and Greed Index
In the 1987 film “Wall Street,” Gordon Gekko famously said that “Greed is good.” But what about fear? Fear is primal. It’s a psychological response to a perceived threat or impending danger. Fear can be good or bad but mostly it’s a survival instinct that helps keep us safe.
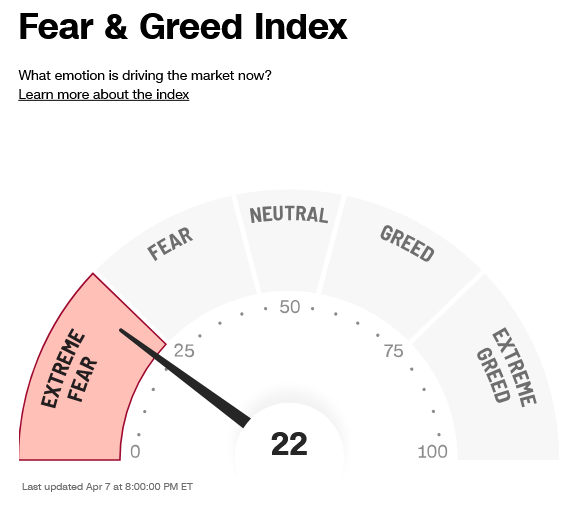 CNN’s Fear and Greed Index is a market sentiment tool that measures the emotions on Wall Street. It tracks investor psychology as it relates to market movements and according to its latest indicators, investors are extremely fearful.
“The market is made up of thousands of stocks. And on any given day, investors are actively buying and selling them. This measure looks at the amount, or volume, of shares on the NYSE that are rising compared to the number of shares that are falling. A low (or even negative) number is a bearish sign. The Fear & Greed Index uses decreasing trading volume as a signal for Fear.” [5]
So, what does “extreme fear” really mean in this context? It’s a warning about the current psychological state of investors and a reflection of how investor anxiety can impact stock prices. The Index has seven, distinct indicators which according to Investopedia provide a useful market timing barometer.
- Stock Price Momentum: A measure of the S&P 500 versus its 125-day moving average (MA).
- Stock Price Strength: The number of stocks hitting 52-week highs versus those hitting 52-week lows on the New York Stock Exchange (NYSE).
- Stock Price Breadth: Analyzing the trading volumes in rising stocks against declining stocks.
- Put and Call Options: The extent to which put options lag behind call options, signifying greed, or surpasses them, indicating fear.
- Junk Bond Demand: Measures the spread between yields on investment-grade bonds and junk bonds.
- Market Volatility: The CBOE’s Volatility Index (VIX) based on a 50-day MA.
- Safe Haven Demand: The difference in returns for stocks versus treasuries. [6]
When fear takes hold on Wall Street investors panic. They sell, liquidate, rush to the exit, and slide into survival mode. Frightened investors don’t think, they react and this creates a domino effect that accelerates losses and can trigger a broader market meltdown.
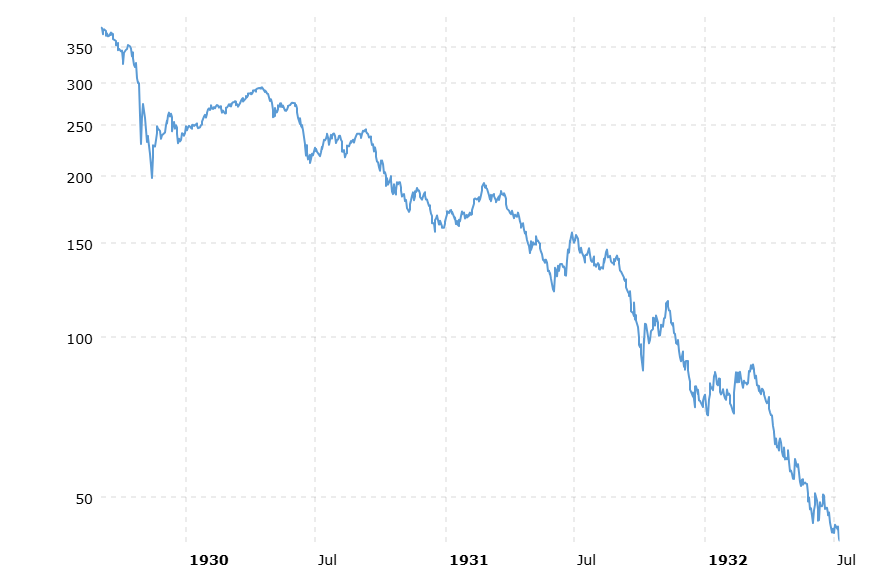
The epic boom of the Roaring Twenties ended in a catastrophic bust.
“The panic began again on Black Monday (October 28), with the market closing down 12.8 percent. On Black Tuesday (October 29) more than 16 million shares were traded. The Dow lost another 12 percent and closed at 198 — a drop of 183 points in less than two months … General Electric fell from 396 on September 3 to 210 on October 29. American Telephone and Telegraph dropped 100 points. DuPont fell from a summer high of 217 to 80, United States Steel from 261 to 166, Delaware and Hudson from 224 to 141, and Radio Corporation of America (RCA) common stock from 505 to 26 … Another 20 years would pass before the Dow regained enough momentum to surpass the 200-point level.” [7]
Why Gold is also “Good”
In an environment of over-valuation, extreme fear, and loss of confidence — gold is a flight to safety. In 1929, the dollar was on the gold standard, making physical gold a unique refuge and store of value for those seeking protection as the markets unraveled.
Amid today’s stock volatility, Middle East unrest, stubborn inflation, and rising recession chatter — gold is again a place investors are turning to preserve wealth. And firms like Goldman Sachs and JPMorgan Chase continue to be very bullish on gold for 2026.
Analysts at Goldman believe the triggers that drove the precious metal to record levels, are still very much in play:
- Central bank purchases: Forecast at 60 tonnes per month in 2026
- Western ETF inflows: About 500 tonnes added since early 2025, above rate-cut expectations
- China gold reserves: 15 consecutive months of purchases through January 2026
- Expected Fed cuts: 0.5% in 2026, adding an estimated $120/oz. of price support
- Gold all-time high: Approximately $5,600 in late January 2026, per CBS News [8]
Meanwhile, JP Morgan stands by its blockbuster prediction of gold reaching $6300/oz this year, despite recent price drops.
“This combination of a historic rally and historic volatility would seem to challenge the case for investing in gold today. However, we remain firmly bullish on gold in 2026, and recently raised our outlook to a range of $6,000 to $6,300 per ounce. The recent sell-off may present a potential entry point for long-term investors, and see potential for further upside as investors look to diversify dollar exposure, hedge geopolitical risk and guard against inflation surprises.” [9]
The warning signs are clear … the CAPE ratio, the fear gauge, consumer sentiment, layoffs, geopolitical tension, slowing growth, and rising prices. The question is not whether risks are building, but whether today’s investors understand the magnitude and will respond accordingly.
ORION METAL EXCHANGE is a top-rated
GOLD IRA DEALER with Best-in-Class CUSTOMER SERVICE.
Call for a FREE Investor Kit and up to $30K in FREE metals (on qualifying purchases).
REPRESENTATIVES ARE AVAILABLE NOW AT: 1-800-559-0088
1 https://www.schwab.com/learn/story/are-stocks-overvalued-5-indicators-to-watch
2 https://www.investopedia.com/terms/c/cape-ratio.asp
3 https://time.com/article/2026/03/26/we-must-prepare-for-an-ai-bubble-now/
4 https://www.wsj.com/tech/ai/ai-spending-tech-companies-compared-02b90046
5 https://www.cnn.com/markets/fear-and-greed
6 https://www.investopedia.com/terms/f/fear-and-greed-index.asp
7 https://www.britannica.com/event/stock-market-crash-of-1929
8 https://www.thestreet.com/investing/goldman-sachs-has-blunt-message-on-gold-price-for-rest-of-2026
9 https://privatebank.jpmorgan.com/nam/en/insights/markets-and-investing/is-it-a-golden-era-for-gold